Thursday, July 25, 2013

Excel Geoflow Data Visualization


Geoflow for Excel 2013 allows us to visualize geographic and temporal data in Excel. It is very simple to use. I created an Excel example with the database of Wal-Mart; I only needed to define the latitude and longitude of each point, and defined what chart to show. Here is a video demo of how easy is to work with Geoflow.


The link of the Excel file is here.
Here is other link how to install Geoflow.If you found this helpful, please share.

Friday, July 19, 2013

Excel Power View: World Economic Outlook

Power View is a powerful add-in that allows us to visualize  the information included in PowerPivot. It includes a canvas page where we can create maps, add charts, upload images and setup tiles.  It has some characteristics similar to Tableau. In this posting I included an small example where I mapped the countries with the highest GDP growth in 2013 and added their respective flags, name and values. It is possible to choose other variables, and years. The world map was created automatically from Bing maps, and the flag images were uploaded from different URL addresses. This new concept of dynamic dashboards will definitively help Excel to compete with other database visualization software


The link of the Excel file is here
If you found this helpful, please share.

Thursday, July 18, 2013

Excel PowerPivot: World Economic Indicators

PowerPivot allows us to organize our information efficiently. We can import databases directly to PowerPivot and create relationships to better handle the information. These relationships help us to structure better pivot tables. For example, I linked three tables which contain data values, list of economic indicators, and country names from the IMF. I created a pivot table from these three different tables and used Excel sliders to extract the relevant variables that we want study. 


Excel file can be found here. Enjoy!

Excel Solver: Optimal Budget

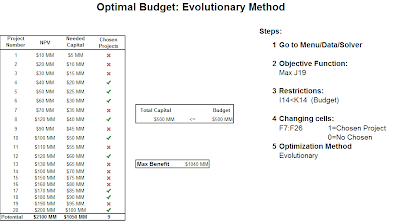
You are in a budget dilemma and do not know what projects to choose. Well, let Excel Solver help you with this task. You only need to active the solver option in Excel and arrange the information follow this pattern:

1. What is your goal? 
2. What are your constraints? 
3. What are your variables to change? 
4. What optimization method is best? 

In this example, I used the sum of NPV as a variable to maximize.
My main constraint was a budget restriction of $500MM. The changing cells are binary numbers (0,1) that solver had to chose to maximize NPV total. The optimization method was evolutionary.


If you found this helpful, please share.
Many other examples can be found in this book
You can donwload the Excel file hereEnjoy!