In financial modeling one of more used functions in business decision-making is the triangular distribution. This function is very practical because it includes business knowledge of the experts. It only needs three elements from them: their worst, most likely, and best scenario.
The challenge: I was able to solve a financial model with uncertainties without using @Risk and VBA. My project has two uncertainties: Sales and growth.
- The first year of sales: Min=80, Max=200, Mode= 170 million units
- Growth rate from 2Y-5Y: Min=3%, Max=8%, Mode=5%
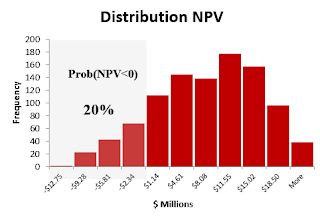
Based on this information I built the model to get the NPV. I used the triangular function to include managers’ perception about sales and growth. To complete the simulation I created a data table to iterate 1000 times the NPV outcomes.
The main results:
- Mean NPV=+$6.6 million with a 95% of chance that this mean will be between $6.1 and $7.0 million.
- 20% of probability of losses (NPV<0).
Some useful tricks:
- Excel does not include a triangular function, so it is necessary to install a free add-in that can be found here. This add-in also includes a large number of optimized probability functions. I hope the next Excel version will include a triangular function in its library.
- New function: NtRandTriangular(X,Min,Max,Mode). It is a random generator for a triangular distribution. X is the number of interactions that we want to simulate (1000). It creates internally a vector with the size of X.
- Excel function: Index(vector,n). This function allows me to extract the specific interaction from the vector NtRandTriangular.
- In the data table the NPV is the final outcome. In order to get new NPVs for each row I linked to the interaction number; this will update and save the new NPV.
Here is the Excel file with the project (link).
If you found this helpful, please share.
If you found this helpful, please share.


No comments:
Post a Comment